
Having previously completed the Naïve Bayes and Gaussian Naïve Bayes implementations in Java, it was just a matter of figuring out how to match the Udacity Intro to Machine Learning python logic and chart the data. A good learning experience and the Java results are similar. The Java code is here.
The first Udacity lesson, getting your feet wet and making sure your python environment is working, creates some random data, runs it through the scikit-learn GaussianNB, and then charts it with mathplotlib. Although the python code is a proof-of-concept I went ahead and matched the Java routines so that anyone else following the course and wishing to use Java could (more) easily trace the logic.
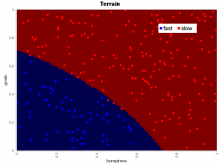
For charting I used the very nicely done JFreeChart, though there is a bit of a learning curve using the API. The first image is for this blog entry is the Java result. It matches pretty closely to the python result, shown here. 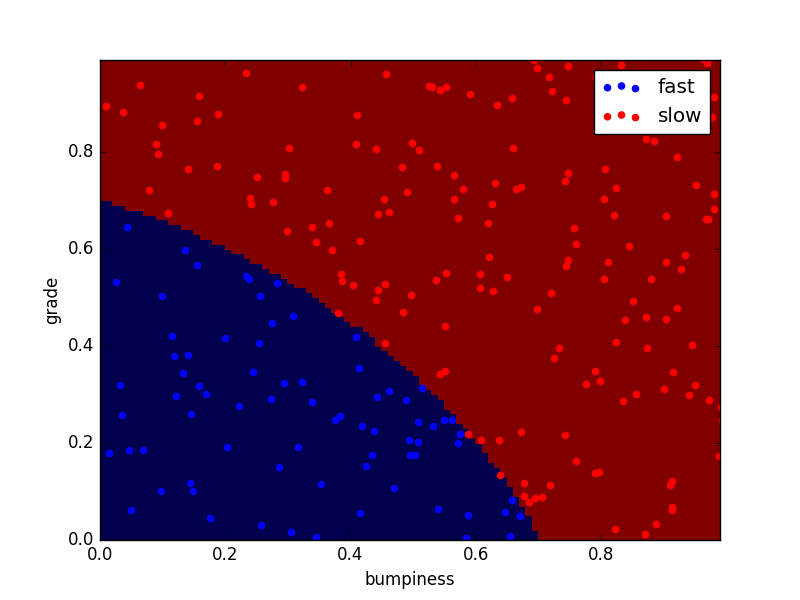 At first it wasn't clear how to create the decision boundary (or frontier, the background blue and red colors that show the separation between fast and slow). This was done by creating 1K data points of random data, running it through the GNB, in which only the class is returned, in this case a 0 or 1. I then divided the chart into cells and plotted the appropriate color for each class for each coordinate (0=blue, 1=red).
This also required working a lot with N-Dimension Arrays (NDArrays) and learning how the numpy routines work. And reshaping of arrays. I had some difficultly getting good internet information on reshaping, or understanding the numpy code, so I treated numpy as a black box and looked and inputs and outputs. The take away? The Java code isn't perfect and might have logic errors.